¶ Humanoid robot dashboard
Developer: Daniel García-Vaglio degv364@gmail.com
This is experimental, this page can cease to exist at any moment
¶ Context
It is nice to be abel to see all the relevant info of a robot in a sigle place. Sometime when you are running experiments, thins break and it is nice to have diagnistics tools that are easy to use and understand at your disposal. This is no a scietific effort, but more of a sort of Quality of life. Many decisions may seem arbitrary, and that is because they are. This project is not intended for publication, but for internal use.
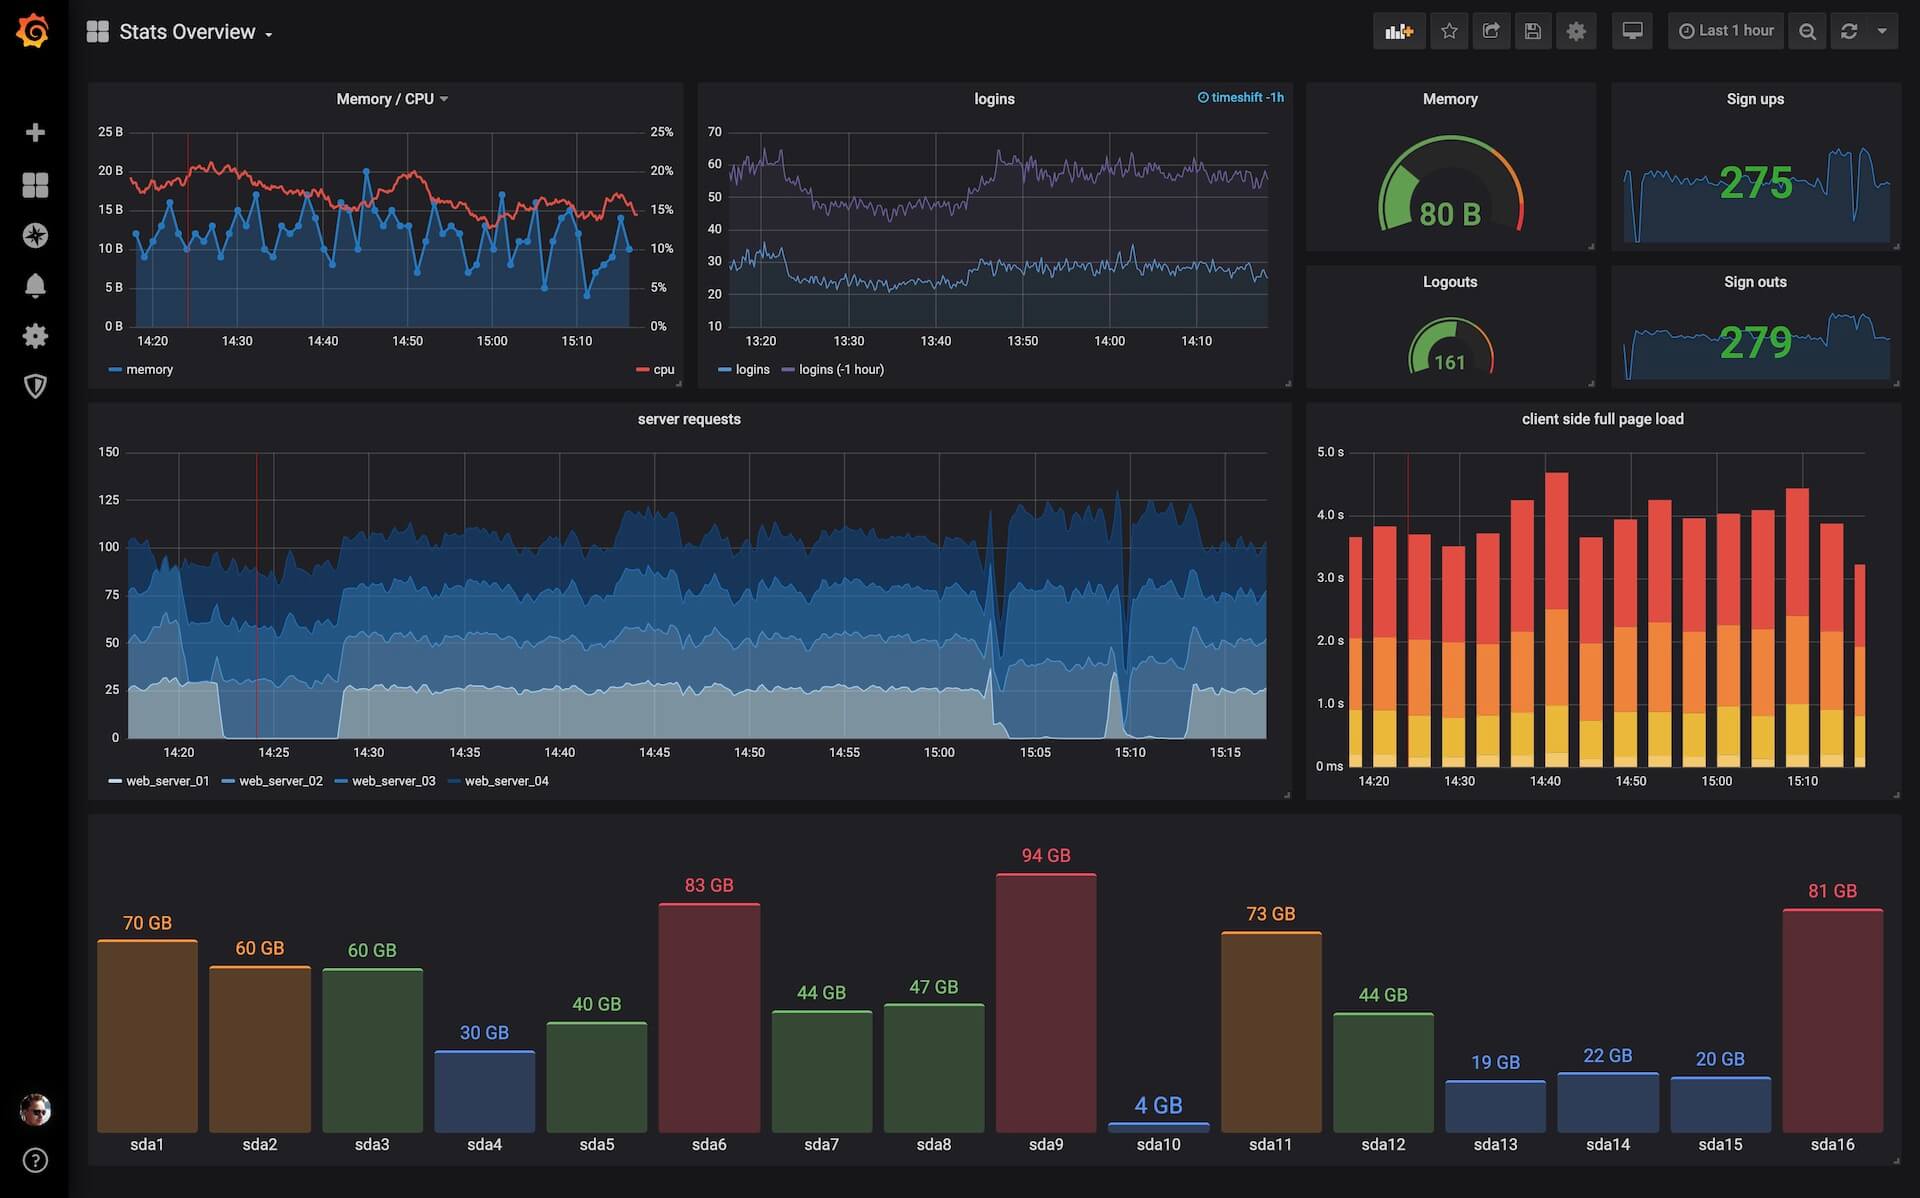
The basic idea is to have access to a dashboard where you can have access to relevant information about the robot. Like for example:
- Charging or not charging
- Current of the charger
- Voltage of the batteries
- Temperatures of each joint
- Current angle of each joint
- Torques on each joint
- RAM, CPU and GPU utilization
This is NOT a new way to control the robot, that is what ROS is for. The dashboard is READ ONLY.
¶ Technologies
There are ROS packages that have been designed for this purpose. The problem is that they are restricted to use ROS only and they have little to no documentation. It is likely that we will want to track things that are outside of ROS (like for example if a certain process or program is executing), so it makes sense to have something that is more general.
¶ Docker
The entire dashboard solution is going to be containerized such that it is easy to share between computers and to deploy on different platforms. We have to keep in mind that this is more like a service than an actual research tool. So what we are going to be "touching" are the nodes and programs arounf teh dashboard that are sending information, but not the actual dashboard service itself.
To install docker in Ubuntu:
# Add Docker's official GPG key:
sudo apt-get update
sudo apt-get install ca-certificates curl gnupg
sudo install -m 0755 -d /etc/apt/keyrings
curl -fsSL https://download.docker.com/linux/ubuntu/gpg | sudo gpg --dearmor -o /etc/apt/keyrings/docker.gpg
sudo chmod a+r /etc/apt/keyrings/docker.gpg

# Add the repository to Apt sources:
echo "deb [arch="$(dpkg --print-architecture)" signed-by=/etc/apt/keyrings/docker.gpg] https://download.docker.com/linux/ubuntu "$(. /etc/os-release && echo "$VERSION_CODENAME")" stable" | sudo tee /etc/apt/sources.list.d/docker.list > /dev/null
sudo apt-get update

# Install
sudo apt-get install docker-ce docker-ce-cli containerd.io docker-buildx-plugin docker-compose-plugin
To test your installation:
sudo docker run hello-world
For a more detailed version visit The oficial documentation
A good thing about Docker, is that it is a very widely used tool for containerization. So it is very common to find stuff for it. For example, there are oficial ROS2 images for Docker
- Repo: https://github.com/osrf/docker_images
- Docker hub: https://hub.docker.com/_/ros/
Remember that by default only the super user can run docker. There is a group called docker and you can add your user to it, but you will be giving your user some Root-level privileges.
¶ Grafana
Grafana is an Open source tool for visualizing data. For more info you can visit their oficial page, the documentation and Docker hub. For our purpose we care that it is open source (AGPL-3.0) and runs on Linux.
¶ Install (Optional)
It is not necessary to install Grafana because we are going to be using a Docker container, but for development purposes I am leaving this here.
# Install prerequisite packages
sudo apt-get install -y apt-transport-https software-properties-common wget

# Impoer GPG key
sudo mkdir -p /etc/apt/keyrings/
wget -q -O - https://apt.grafana.com/gpg.key | gpg --dearmor | sudo tee /etc/apt/keyrings/grafana.gpg > /dev/null

# Add repository for stable releases
echo "deb [signed-by=/etc/apt/keyrings/grafana.gpg] https://apt.grafana.com stable main" | sudo tee -a /etc/apt/sources.list.d/grafana.list

# Updates the list of available packages
sudo apt-get update

# Installs the latest OSS release:
sudo apt install grafana
Grafana will install a server that is managed with systemd. You can start it with
sudo systemctl daemon-reload
sudo systemctl start grafana-server
To enable the server to execute at boot just run:
sudo systemctl enable grafana-server.service
¶ Docker
To run grafana with Docker, it is recommended to first set up your storage. This is because Docker containers loose all their info once they shutdown. The way to prevent it is by using persistent storage.
# create a persistent volume for your data
docker volume create grafana-storage

# verify that the volume was created correctly
# you should see a json output
docker volume inspect grafana-storage
Then run the grafana container with:
docker run -d -p 3000:3000 --name=grafana --volume grafana-storage:/var/lib/grafana grafana/grafana
The following is an example of a docker-compose.yml that can be used. Docker compose is another way of starting the container. This method is more useful because it allows us to orchestrate several containers.
version: "3.8"
services:
  grafana:
    image: grafana/grafana:latest
    container_name: grafana
    restart: unless-stopped
    environment:
      - TERM=linux
      - GF_INSTALL_PLUGINS=grafana-clock-panel,grafana-polystat-panel
    ports:
      - '3000:3000'
    volumes:
      - 'grafana_storage:/var/lib/grafana'
volumes:
  grafana_storage: {}
You start the container with
docker compose up -d
¶ First start
Grafana is configured by default to be accesible at http://localhost:3000
When you start Grafana for the first time, it will ask for a username and pasword. This first time you should write admin in both. Then it will prompt you to change it.
¶ Influx DB
Influx DB is a Database for time series data written in Rust. You can find the Source Code here. It is licensed under Apache 2.0 and MIT, both are compatible with what we do in ARCOS-Lab. For more information you can take at the Official documentation.
¶ Docker
InfluxDB doesn't offer good ways to isntall their software. So we are going to use Doker as is.
First create a volume to persist our database
# create a persistent volume for your data
docker volume create influxdb-storage

# verify that the volume was created correctly
# you should see a json output
docker volume inspect influxdb-storage
Then run the container using this volume
docker run -d --name influxdb -p 8086:8086 --volume influxdb-storage:/var/lib/influxdb2 influxdb:2.7.1 --reporting-disabled
The --reporting-disabled flag is to prevent our database from sending telemetry data to InfluxData, the company developing InfluxDB.
¶ Influx CLI (optional)
Influx CLI is a handy tool for configuring the database. Many of the things you do with the CLI you can do them with a UI, you just have to go to http://localhost:8086
Download and unpack the client:
wget https://dl.influxdata.com/influxdb/releases/influxdb2-client-2.7.3-linux-amd64.tar.gz
tar xvzf path/to/influxdb2-client-2.7.3-linux-amd64.tar.gz
Now in order to add the executable to your PATH we will have to move it. Please not that this step will only work if you already followed the tutorial on xstow for local installations.using-stow-for-local-installations
cp influxdb2-client-2.7.3-linux-amd64/influx ~/local/bin/
¶ Initial Set up
- Navigate to http://localhost:8086
- Click Get started
- Enter a Username for your initial user.
- Enter a Password and Confirm Password for your user.
- Enter your initial Organization Name.
- Enter your initial Bucket Name.
- Click Continue.
- Copy the provided operator API token and store it for safe keeping.
The API token that was generated has operator permission. If you want finer access you will have to create an All access token
If you decide to use the CLI, it is quite useful to setup a profile, so that you don't have to pass your credentials every time you interact with the database.
influx config create \
  --config-name default \
  --host-url http://localhost:8086 \
  --org INFLUX_ORG \
  --token INFLUX_API_TOKEN \
  --active